ESP32 Sensor Data Transmission Sample
What We’ll Do
- Create a sample that sends data using a temperature and humidity sensor and creates graphs. For a simple sample code using temperature and humidity API, see here.
Required Items
- ESP32
- USB cable (for data transfer)
- Temperature and humidity sensor (DHT11, etc.)
- Jumper wires
- Breadboard (optional)
Steps
- Set up ESP32 development environment (PlatformIO)
- Connect/read temperature and humidity sensor
- Run data transmission sample
- Verify data transmission and create graphs
- (Bonus) Configure OTA updates
1. Set Up ESP32 Development Environment (PlatformIO)
Set up ESP32 development environment using PlatformIO.
Install PlatformIO
- Download and install PlatformIO IDE
- Installing as a Visual Studio Code extension is recommended
- Launch Visual Studio Code and verify that PlatformIO extension is enabled
Create Project
- Select “New Project” from PlatformIO home screen
- Enter project name (e.g.,
esp32-miniviz) - Select “ESP32 Dev Module” as Board
- Select “Arduino” as Framework
- Create project
- (Set baud rate to 115200)
Example platformio.ini file
[env:esp32doit-devkit-v1]
platform = espressif32
board = esp32doit-devkit-v1
framework = arduino
lib_deps = adafruit/DHT sensor library@^1.4.6
monitor_speed = 115200
Add Required Libraries
Add required libraries to the project’s platformio.ini file.
2. Connect/Read Temperature and Humidity Sensor
Sensor Connection
Connect a temperature and humidity sensor such as DHT11 to ESP32.
DHT11 Connection Example:
DHT11              ESP32
------             ----------------
(1) VCC  --------> 3.3V
(2) DATA --------> GPIO4
(3) NC   --------> -
(4) GND  --------> GND
3. Run Data Transmission Sample
Create ESP32 code to send data to Miniviz API.
Create Code
Write the following content in src/main.cpp file (replace PROJECT_ID and TOKEN with actual values):
-> See ESP32 Sample Code.
Build and Upload
- Connect ESP32 to PC with USB cable
- Run the following command from PlatformIO terminal:
- Check operation with serial monitor:
4. Verify Data Transmission and Create Graphs
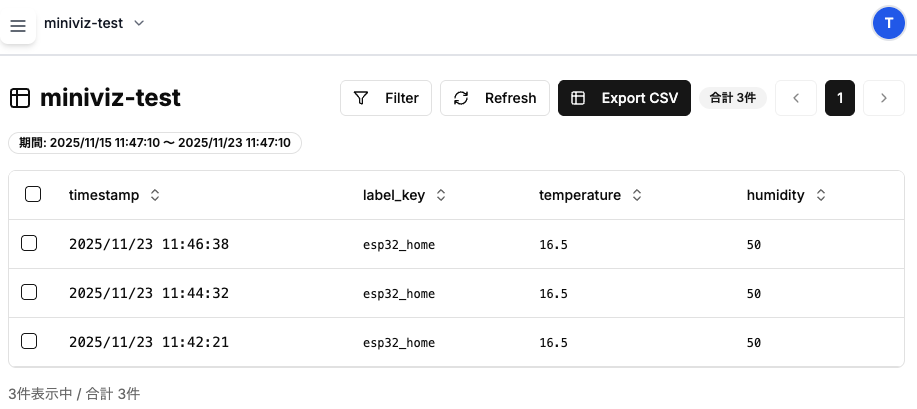
Verify Data Transmission
- Log in to Miniviz web interface
- Check sent data from Database menu
- Verify that temperature and humidity data is displayed
Create Graphs
- Create graphs from Visualize menu
- Select graph type (line chart recommended)
- Select temperature and humidity as data sources
- Verify that graphs are displayed correctly
For details, see “5. Create Charts” in Quick Start.