Send temperature & humidity data with ESP32
What We'll Do
Send data using a temperature and humidity sensor and create graphs.
Required Items
- ESP32
- USB cable (for data transfer)
- Temperature and humidity sensor (DHT11, etc.)
- Jumper wires
- Breadboard (optional)
Steps
- Set up ESP32 development environment (PlatformIO)
- Connect/read temperature and humidity sensor
- Run data transmission sample
- Verify data transmission and create graphs
- (Bonus) Configure OTA updates
1. Set Up ESP32 Development Environment (PlatformIO)
Set up ESP32 development environment using PlatformIO.
Install PlatformIO
- Download and install PlatformIO IDE
- Installing as a Visual Studio Code extension is recommended
- Launch Visual Studio Code and verify that PlatformIO extension is enabled
Create Project
- Select "New Project" from PlatformIO home screen
- Enter project name (e.g.,
esp32-miniviz) - Select "ESP32 Dev Module" as Board
- Framework as "Arduino"
- Create project
tip
Set the baud rate to 115200 to avoid garbled text in the serial monitor.
Example platformio.ini file
[env:esp32doit-devkit-v1]
platform = espressif32
board = esp32doit-devkit-v1
framework = arduino
lib_deps = adafruit/DHT sensor library@^1.4.6
monitor_speed = 115200
Add Required Libraries
Add required libraries to the project's platformio.ini file.
2. Connect/Read Temperature and Humidity Sensor
Sensor Connection
Connect a temperature and humidity sensor such as DHT11 to ESP32.
DHT11 Connection Example:
DHT11              ESP32
------             ----------------
(1) VCC  --------> 3.3V
(2) DATA --------> GPIO4
(3) NC   --------> -
(4) GND  --------> GND
3. Run Data Transmission Sample
Create ESP32 code to send data to Miniviz API.
Create Code
Write the following content in src/main.cpp file (replace PROJECT_ID and TOKEN with actual values):
Build and Upload
- Connect ESP32 to PC with USB cable
- Run the following command from PlatformIO terminal:
- Check operation with serial monitor:
Sample Code
This is the full version of the code used in this guide.
- C++ (Arduino)
#include <Arduino.h>
#include <DHT.h>
#include <WiFi.h>
#include <HTTPClient.h>

//----------------------------------------
// Configuration
//----------------------------------------
const int PIN_DHT = 4;
DHT dht(PIN_DHT, DHT11);

const char *ssid = "WIFI_SSID";
const char *password = "WIFI_PASSWORD";

// Miniviz API
const char *project_id = "MINIVIZ_PROJECT_ID";
const char *token = "MINIVIZ_API_TOKEN";

String endpoint = String("https://api.miniviz.net/api/project/") +
                  project_id + "?token=" + token;

// Deep Sleep (90 seconds)
const uint64_t SLEEP_INTERVAL_US = 90ULL * 1000000ULL;


//----------------------------------------
// Wi-Fi Connection
//----------------------------------------
void connectWiFi()
{
  Serial.println("Connecting to Wi-Fi...");
  WiFi.mode(WIFI_STA);
  WiFi.begin(ssid, password);

  int retry = 0;
  while (WiFi.status() != WL_CONNECTED && retry < 30) {
    delay(300);
    Serial.print(".");
    retry++;
  }
  Serial.println();

  if (WiFi.status() == WL_CONNECTED) {
    Serial.println("Wi-Fi connected");
  } else {
    Serial.println("Wi-Fi connection failed");
  }
}

//----------------------------------------
// NTP Time Synchronization
//----------------------------------------
void syncTime()
{
  Serial.println("Syncing NTP...");
  configTime(0, 0, "ntp.nict.jp", "time.google.com");

  struct tm timeinfo;
  while (!getLocalTime(&timeinfo)) {
    delay(200);
    Serial.print("*");
  }
  Serial.println("\nTime synced");
}

//----------------------------------------
// UNIX Timestamp in Milliseconds
//----------------------------------------
uint64_t getTimestampMs()
{
  struct timeval tv;
  gettimeofday(&tv, NULL);
  return (uint64_t)tv.tv_sec * 1000ULL + (tv.tv_usec / 1000ULL);
}

//----------------------------------------
// POST to Miniviz
//----------------------------------------
void sendToMiniviz(float temp, float humid)
{
  if (WiFi.status() != WL_CONNECTED)
    connectWiFi();

  HTTPClient http;
  http.begin(endpoint);
  http.addHeader("Content-Type", "application/json");

  uint64_t ts = getTimestampMs();

  String body = "{";
  body += "\"timestamp\":" + String(ts) + ",";
  body += "\"label_key\":\"esp32_home\",";
  body += "\"payload\":{";
  body += "\"temperature\":" + String(temp) + ",";
  body += "\"humidity\":" + String(humid);
  body += "}}";

  int code = http.POST(body);
  Serial.println("HTTP code: " + String(code));
  Serial.println(http.getString());
  http.end();
}

//----------------------------------------
// Setup
//----------------------------------------
void setup()
{
  Serial.begin(115200);
  delay(200);

  dht.begin();
  connectWiFi();
  syncTime();
}

//----------------------------------------
// Loop (exits after one iteration due to DeepSleep)
//----------------------------------------
void loop()
{
  float t = dht.readTemperature();
  float h = dht.readHumidity();

  Serial.printf("Temperature: %.2f°C  Humidity: %.2f%%\n", t, h);

  sendToMiniviz(t, h);

  Serial.println("Entering deep sleep...");
  esp_deep_sleep(SLEEP_INTERVAL_US);
}
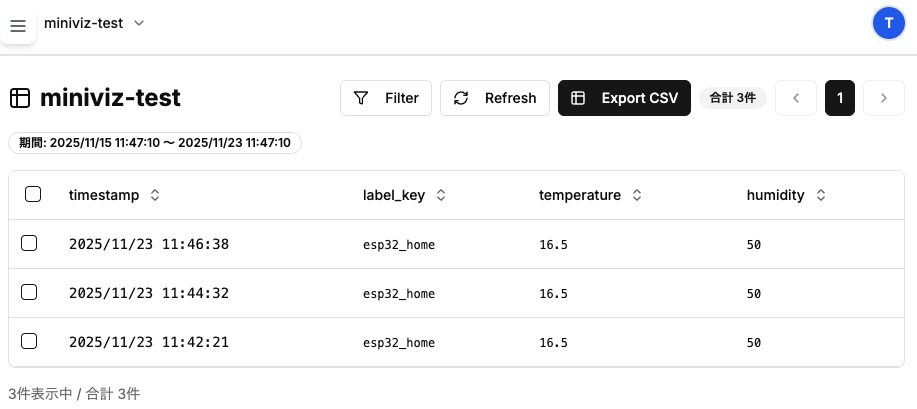
4. Verify Data Transmission and Create Graphs
Verify Data Transmission
- Log in to Miniviz web interface
- Check sent data from Database menu
- Verify that temperature and humidity data is displayed
Create Graphs
- Create graphs from Visualize menu
- Select graph type (line chart recommended)
- Select temperature and humidity as data sources
- Verify that graphs are displayed correctly
For details, see "5. Create Charts" in Quick Start.